As students take assessments throughout the school year, the Assessment data view will begin to show data in the 'Growth' columns. Here is an example Assessment data view for a class with Growth data:
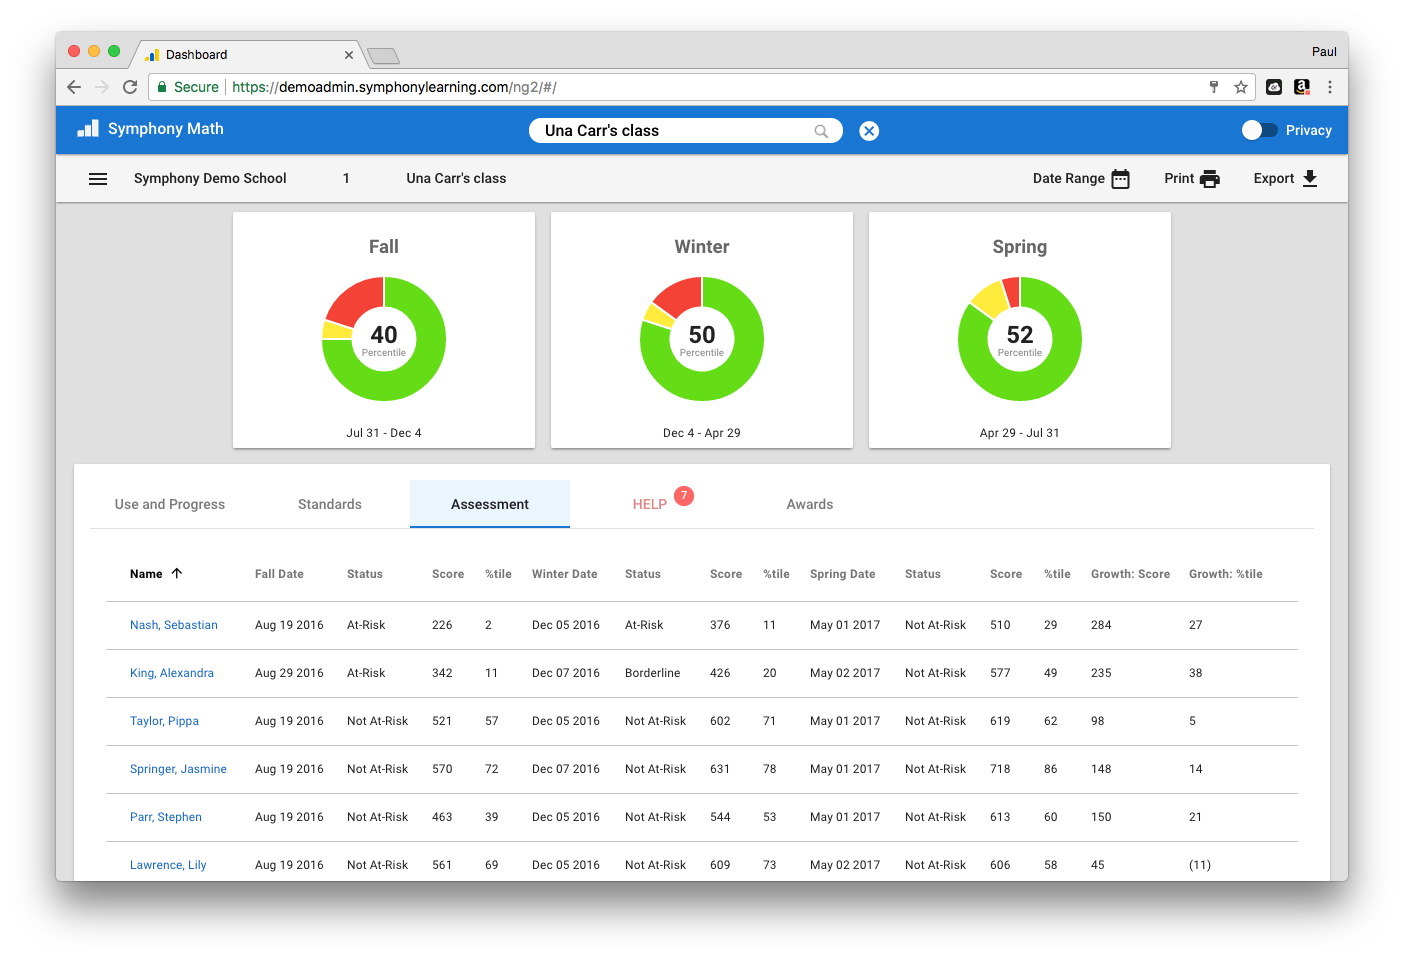
In this data view, 'Growth' refers to the change between the FIRST assessment and the LATEST assessment for a student. For example, Sebastian Nash scored in the 2nd percentile in the Fall test, and in the latest assessment (Spring). scored in the 29th percentile. This improvement of 27 percentile points is shown in the far right 'Growth: %tile' column. Growth data is reported for both change in Scale Score and Percentile Rank.
An important distinction should be noted regarding the top circle graphs and the data view Growth scores. The top circle graphs show the average score of ALL results within a testing window. The 'Fall' circle graph above shows 40, which is the average of all percentiles recorded during the Fall Testing Window. The Growth column is only calculated if a student has completed AT LEAST 2 tests. For this reason, group results shown in the top circles cannot be used to infer Growth. In the example above, it would be natural to infer Growth of 10 percentile points from the Fall to Winter testing period. However, if some students did not take both assessments, then the Growth may be different than the average percentile.